Political Popularity of Misinformation
By: Aaron Chan, Catherine Tao, Matthew Sao

Introduction
Social media has become the main source of easily accessible and digestible information for field experts and organizations to publicly spread news, but at the same time it has become a place where individuals can spread their beliefs as fact and influence others’ opinions on subjects that readers have yet to be informed about. As the internet is a place open for anyone to share information, the validity of information presented is not always guaranteed to be accurate or benevolent.
For our research on Political Popularity of Misinformation, we want to research the influence politicians have on Twitter, a well known social media platform for users to voice their opinions to a wider audience. The information shared on Twitter that we are interested in will be grouped into scientific information or conspiracy information. We have chosen ten politicians to represent our scientific group and another ten politicians to represent our misinformation group. Politicians can easily sway public opinion with a simple tweet, therefore we wanted to analyze how much they can influence other Twitter users with their tweets. This specific analysis is interesting because we are able to determine whether a politician’s tweet has influence on the public based on tweet engagement and a politician’s growth on Twitter.
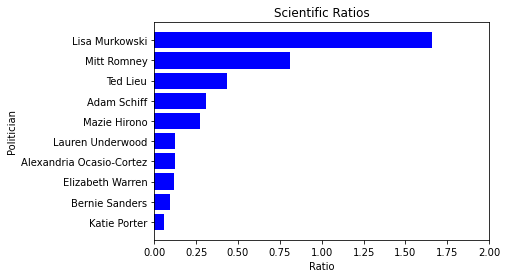
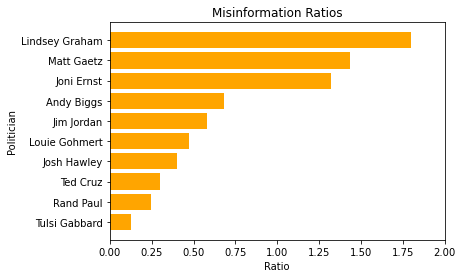
Ratios
To analyze reception to a particular tweet, we chose to use the concept of ratios or “getting ratioed” on Twitter. For our analysis, we define the ratio of an individual tweet to be two times the number of replies to the number of likes and retweets a tweet receives.
\(\dfrac{2 * \#\:of\:replies}{\#\:of\:likes + \#\:of\:retweets}\)
Ratios allow for a quantitative way to measure how controversial a tweet is, with higher ratios signaling a more disputed tweet. We weigh replies more heavily than likes and retweets due to the increased amount of effort it takes to write out a reply to a tweet as opposed to liking or retweeting that same tweet.
Popularity Estimates
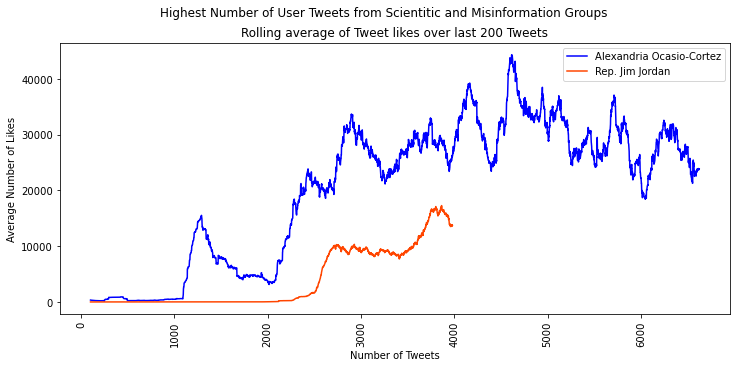
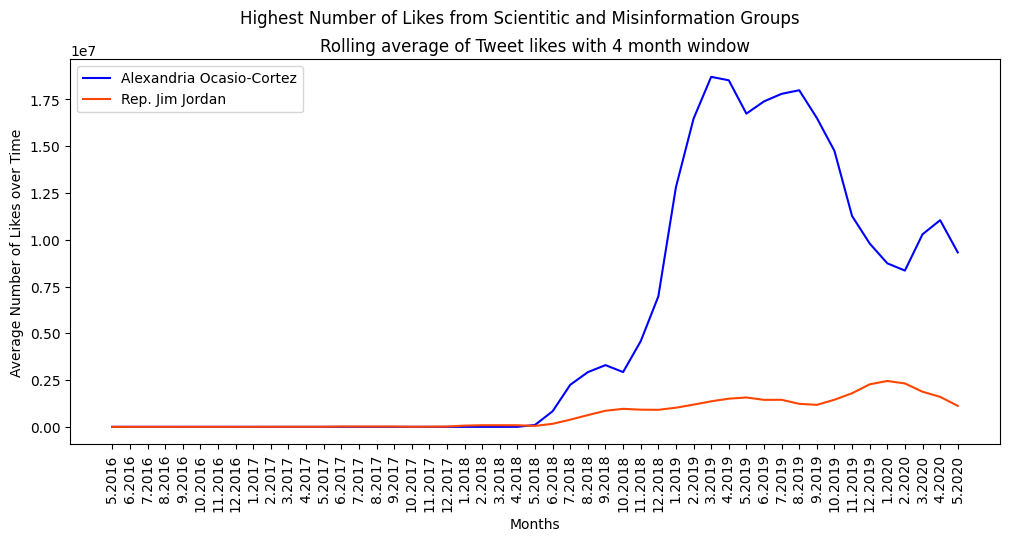
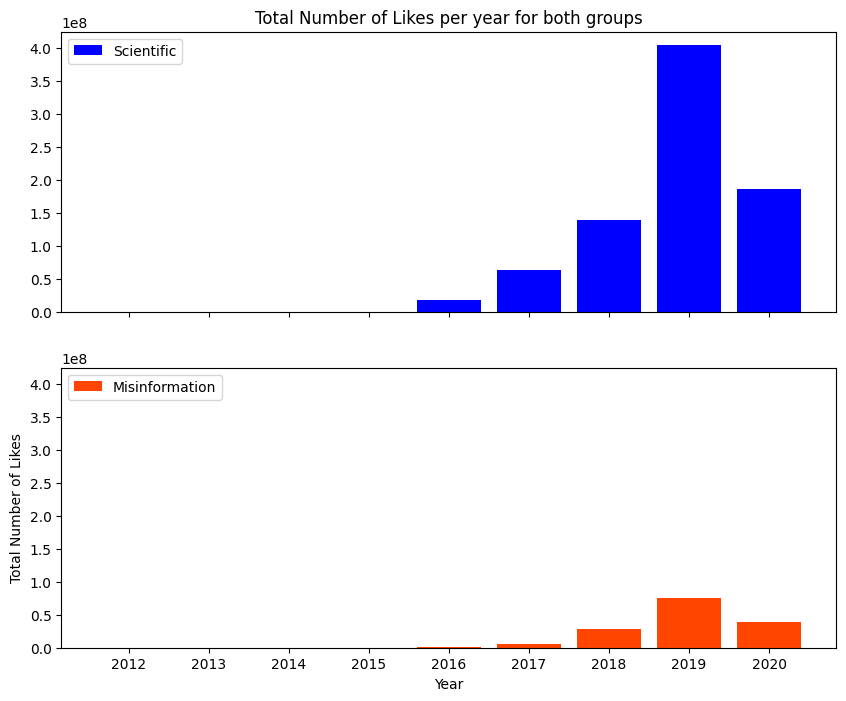
To estimate the popularity of our politicians, we analyze the number of likes from each tweet for each politician over the span of a few years that they are active on Twitter. The purpose of these metrics are to analyze a politician’s growth over time using the given information from each tweet.
Our metrics are split by time or by number of tweets. Over time will track the politician’s Tweet likes over all months that they were active while over tweets will track the number of tweets that the politician has tweeted.
The metrics are further divided into either cumulative or rolling. Cumulative will build on the previous amount of likes and build further on it. This is useful to measure the politician who generated the most following to find who may be the “most popular” politician.
Our rolling metrics will take into account a trailing period of time or a trailing number of tweets to aggregate on as a way to see how popular politicians are at a given moment of time while also taking into account some recency. The rolling windows will be aggregated by the max of the likes or the average of the likes in the window.
Permutation Tests
A permutation test takes in two samples and determines the chance that the samples come from the same distribution. For our research, we compare the distributions between our two groups with the following null and alternative hypothesis:
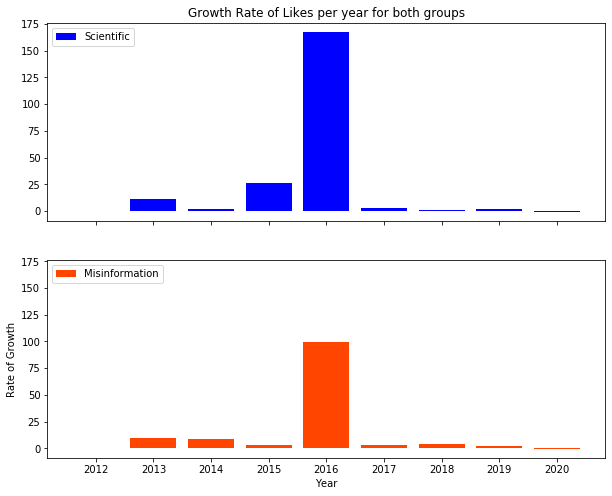
Null Hypothesis: The growth of likes for our misinformation group is the same as the growth for our scientific group over each year.
Alternative Hypothesis: The growth of likes for our misinformation group will be different from our scientific group over each year.
We normalize the growth of likes for each year by calculating the percentage growth from their previous year. The permutation test shows how each group grew from year to year. This helps show the significant years and compares the growth of our scientific group to our misinformation group.
Results
As a result of our investigation, we found that politicians who spread misinformation often have a higher ratio value and less overall likes per tweet. This higher ratio value means that these politicians are more likely to spread controversial information on Twitter. This also shows that people who are viewing their tweets on Twitter are engaging in the politicians' tweets by commenting more compared to liking or retweeting.
In contrast, we see that politicians who spread scientific information on Twitter have lower ratios and significantly more likes on their tweets. This is interesting to note because it shows a clear distinction and result between our two groups.
When comparing the two groups, we see that our scientific group has been steadily increasing in growth over the years while our misinformation group has only been growing significantly in the past recent years.
The overall result of our research shows that a politician has the most growth through spreading non-controversial, scientific information because this yields a steady growth over time in comparison to spreading controversial information.